
Bypass capacitor S-parameter models: What you need to know
- Posted by doEEEt Media Group
- On April 9, 2020
- 0
Whether to think in the time domain or frequency domain, learn how to interpret capacitor manufacturer S-parameter models and how to apply them to your simulations.
Bypass capacitors are everywhere in power distribution networks. If you think in the time domain, you may say that bypass capacitors store and supply charge on demand to the loads. If you think frequency domain, you may say that bypass capacitors help to meet the impedance target. Either way, you need good simulation models for your bypass capacitors so that you can do pre- and post-layout simulations with confidence.
As an example, let’s use a capacitor made by Murata, a 47 µF 1210-size X5R ceramic capacitor: GRM32ER60J476ME20. Murata has several simulation models available for their ceramic capacitors: simple and accurate C-R-L SPICE subcircuits and simple and accurate S-parameter models for shunt- and series-connected configurations as well as dynamic models. The simple SPICE model is a series C-R-L circuit with three frequency-independent elements [1], shown in Figure 1. For this particular capacitor, the capacitance is 37.4 µF, the resistance is 1.98 mΩ and the inductance is 535 pH. Notice that the capacitance is not the nominal 47 µF value. That’s because this model is valid for small signals and the nominal capacitance is tested at 0.5 Vrms or 1 Vrms (for details, see for instance [2]). This model is linear, time invariant, and it can be used in any kind of simulator: spreadsheets, SPICE-like circuit simulators, or frequency-domain simulators. It captures the big picture—the capacitive region, the inductive region, and the minimum impedance at the series resonance—correctly.
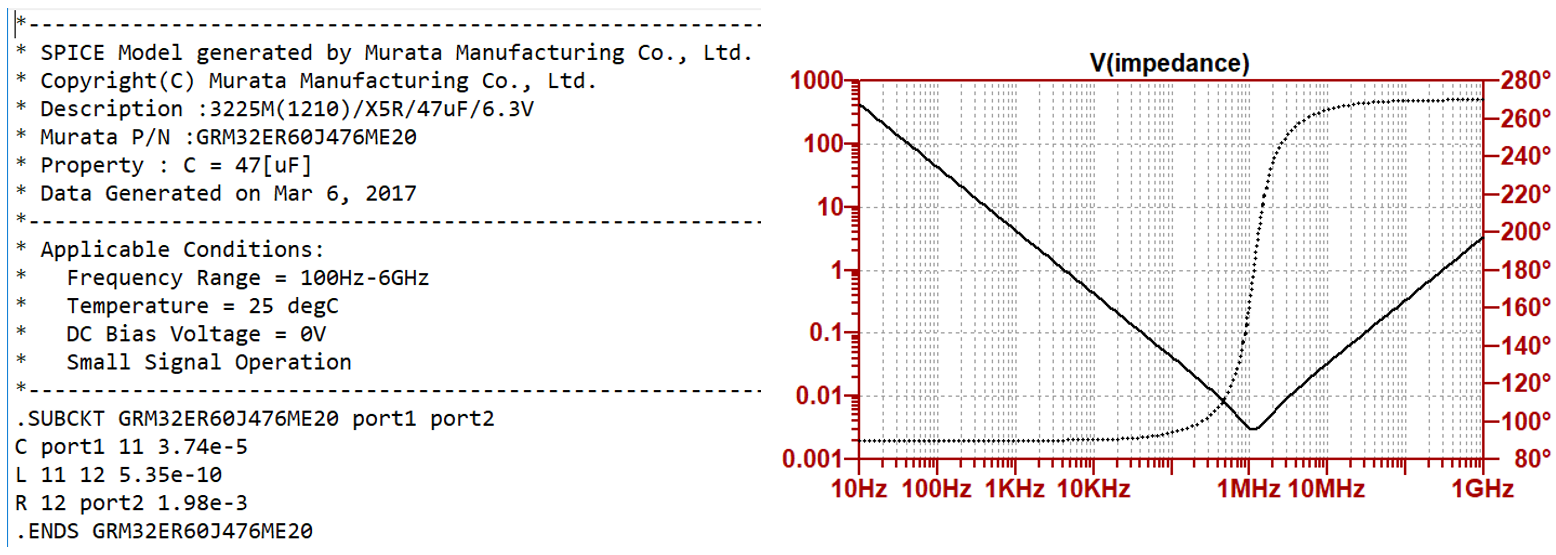
Figure 1. C-R-L model of bypass capacitor and its impedance vs. frequency curve. Simple SPICE listing of a Murata GRM32ER60J476ME20 part is on the left, impedance plot is on the right. The solid line shows magnitude on the left axis and the dotted line is the phase on the right axis.
Because the model is linear, it doesn’t differentiate between the small-signal and large-signal behaviors. For linear models, we assume the two behaviors are identical. New high-density ceramic capacitors may have strong enough nonlinear behavior that you need to take them into account in your simulations. For the very demanding simulation needs when nonlinearity or temperature/bias dependence must also be simulated, Murata provides the dynamic models [3]. In addition to dynamic models, more accurate and complex circuit-representation models are also available. We will cover those in a later article; here for the rest of the article we focus on S-parameter models.
S-parameter models are small-signal linear behavioral models of a component or circuit with any number of ports. They can easily capture frequency dependencies. S-parameters can, for example, properly capture the decay of capacitance, the complete variations of effective series resistance, and the lowering of inductance, as frequency increases. They can even capture secondary internal resonances. Between a Start and Stop frequency, the complex values of the S matrix elements are listed at a series of frequencies. S-parameter listings follow the Touchstone format, Figure 2 shows a partial listing.
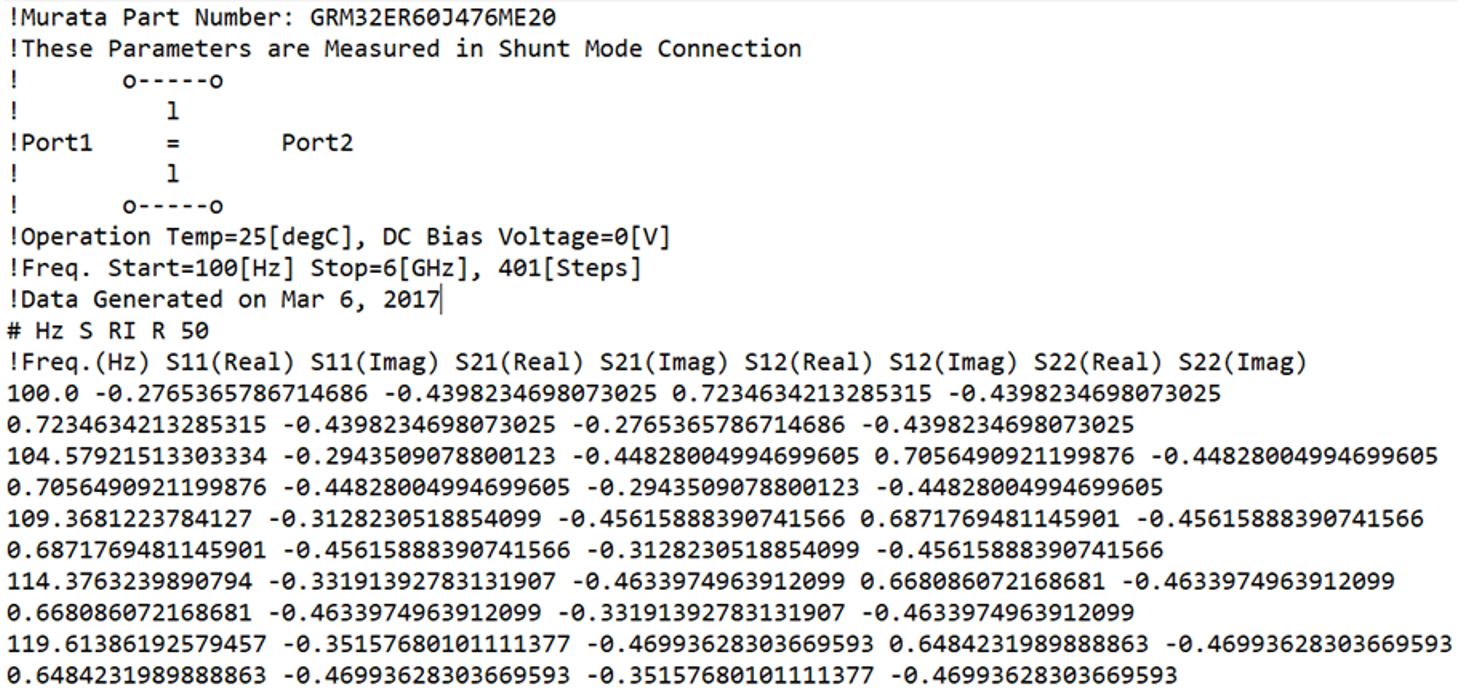
Partial listing of the Touchstone file with the Shunt-mode S-parameter data
Because S parameters are “black-box” behavioral models, you need to be careful about the start and stop frequencies and the available frequency points in between. If you need to do simulations outside of the model’s frequency range, then check what your simulation tool does under those circumstances. For frequency points falling in between frequency points of the model, regular interpolation usually works well. If you need to go significantly below the start frequency or above the stop frequency, the simulation tool has to make a guess about the behavior of our component, which may or may not match the real behavior.
Once you take care of the model’s frequency range, you need to decide how to connect the model to the rest of the circuit. As Figure 3 illustrates, a regular two-terminal capacitor is a one-port device. For parallel bypass applications, where one terminal is connected to the common return (ground), one-port models would be sufficient. But for DC-blocking applications, typical for signal interconnects where the driver and receiver may have different DC potential, we need two-port models. To have a consistent model format, it is common today to represent these capacitors with two-port S parameters for both applications. At this point, the obvious question arises: what should we do with the two ports of our model in our simulator if this model represents a bypass capacitor?
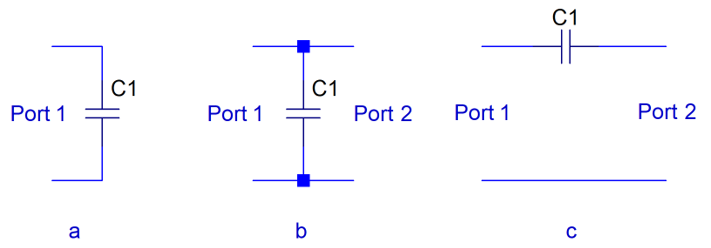
Figure 3. One and two-port capacitor models.
The answer is based on simple common sense. For DC blocking applications, you have to select the series model; the wiring of the model is trivial. For bypass applications, you can use either of the model representations, as long as you properly connect the ports. When the model represents a shunt mode connection, connect Port 1 to your power network and leave Port 2 open. Alternately, you can connect Port 2 to our network and leave Port 1 open, it will give the same result.
When the model represents a series connection, you have to connect Port 1 to your network and short Port 2, otherwise the capacitor is left floating and won’t connect to the rest of the circuit. Alternately, you can connect Port 2 to your network and short Port 1, which will produce the same result. If you make sure that the connection of the capacitor model follows the above guidelines, the simulator will take care of the rest and you’ll get the correct result.
If you know the impedance/admittance of our capacitor at each frequency point, you can calculate the S-matrix elements for series mode and parallel mode connections. The S parameters can be found by using the following formulas [4]:
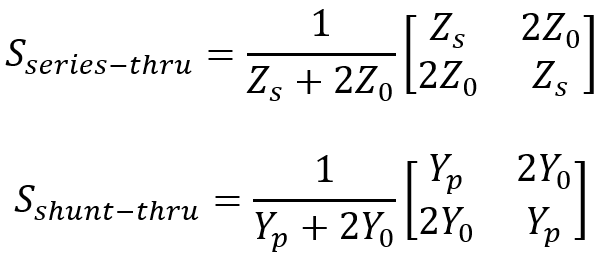 In the formulas ZS is the impedance of the series-connected capacitor, Yp is the admittance of the parallel-connected capacitor and Z0 and Y0 are the reference impedance and admittance, respectively. Note that because the matrix represents a symmetric and reciprocal network, the matrix will show symmetry along both diagonals: S11=S22 and S21=S12. All four matrix elements depend on the unknown impedance or admittance. Don’t get mislead if you hear people say “Oh, this model must be fake. It shows perfect symmetry and reciprocity. It cannot be measured data.” Yes, the simulation model is not measured data, but it is based on measured data. The reciprocity and symmetry of the simulation model must be “perfect” within numerical precision, otherwise you can’t use it in a simulation.
We use the “Accurate” S parameter models of the same Murata GRM32ER60J476ME20 capacitor to illustrate the various S-parameter models. Figure 4 plots the S-parameter magnitudes for the shunt-connection model. The S parameters for the series-connection model are plotted in Figure 5. Fig. 2 shows the first few lines of the Touchstone model file for shunt mode connection.
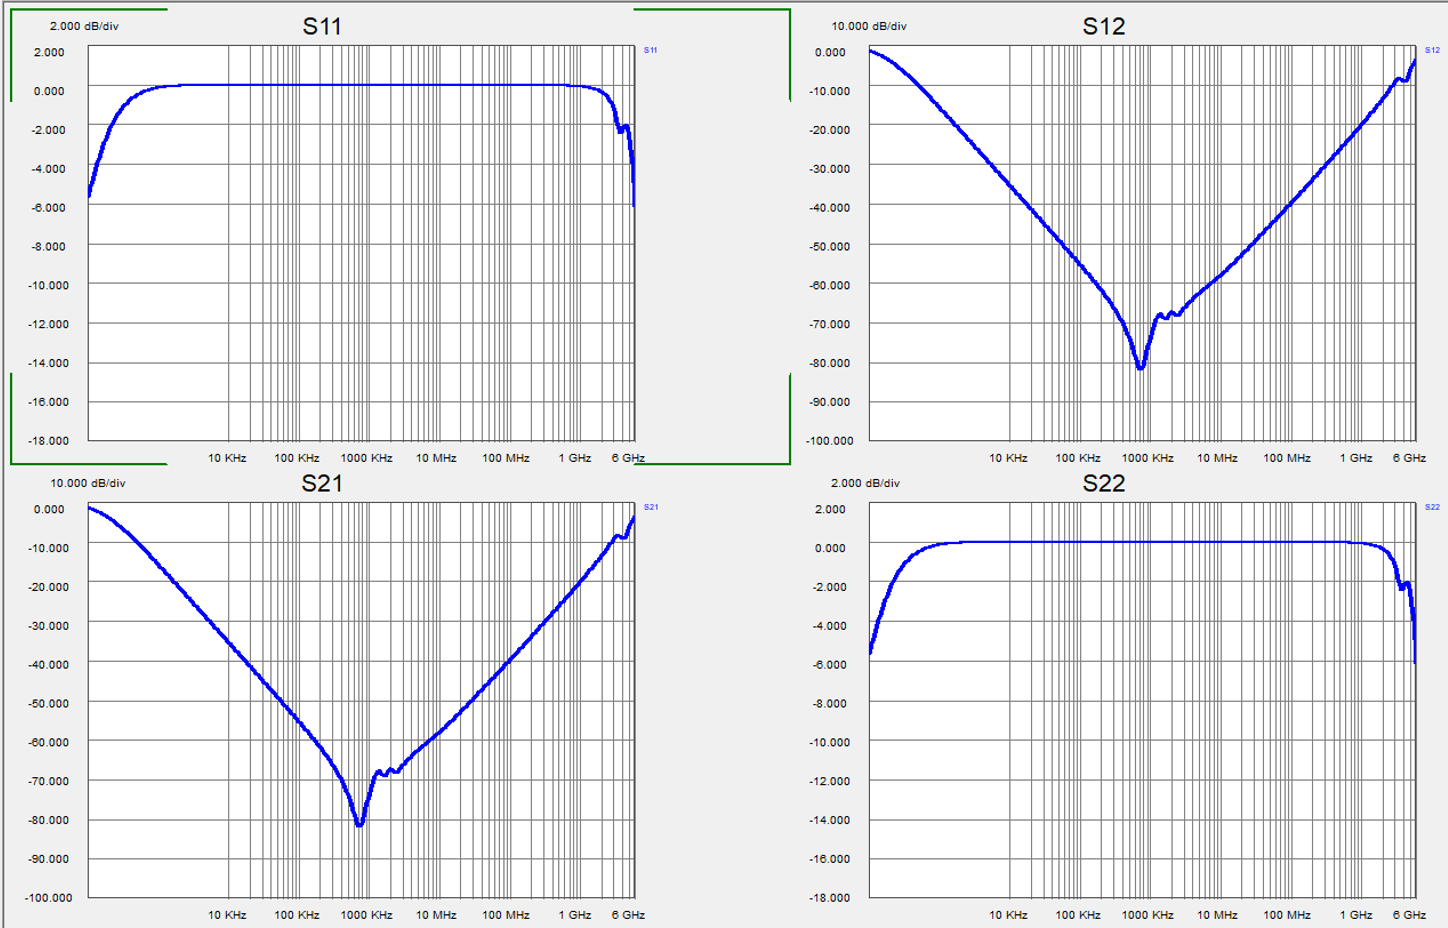
Figure 4 Accurate S-parameter model of the GRM32ER60J476 capacitor in Shunt mode shows identical responses for S11 and S12.
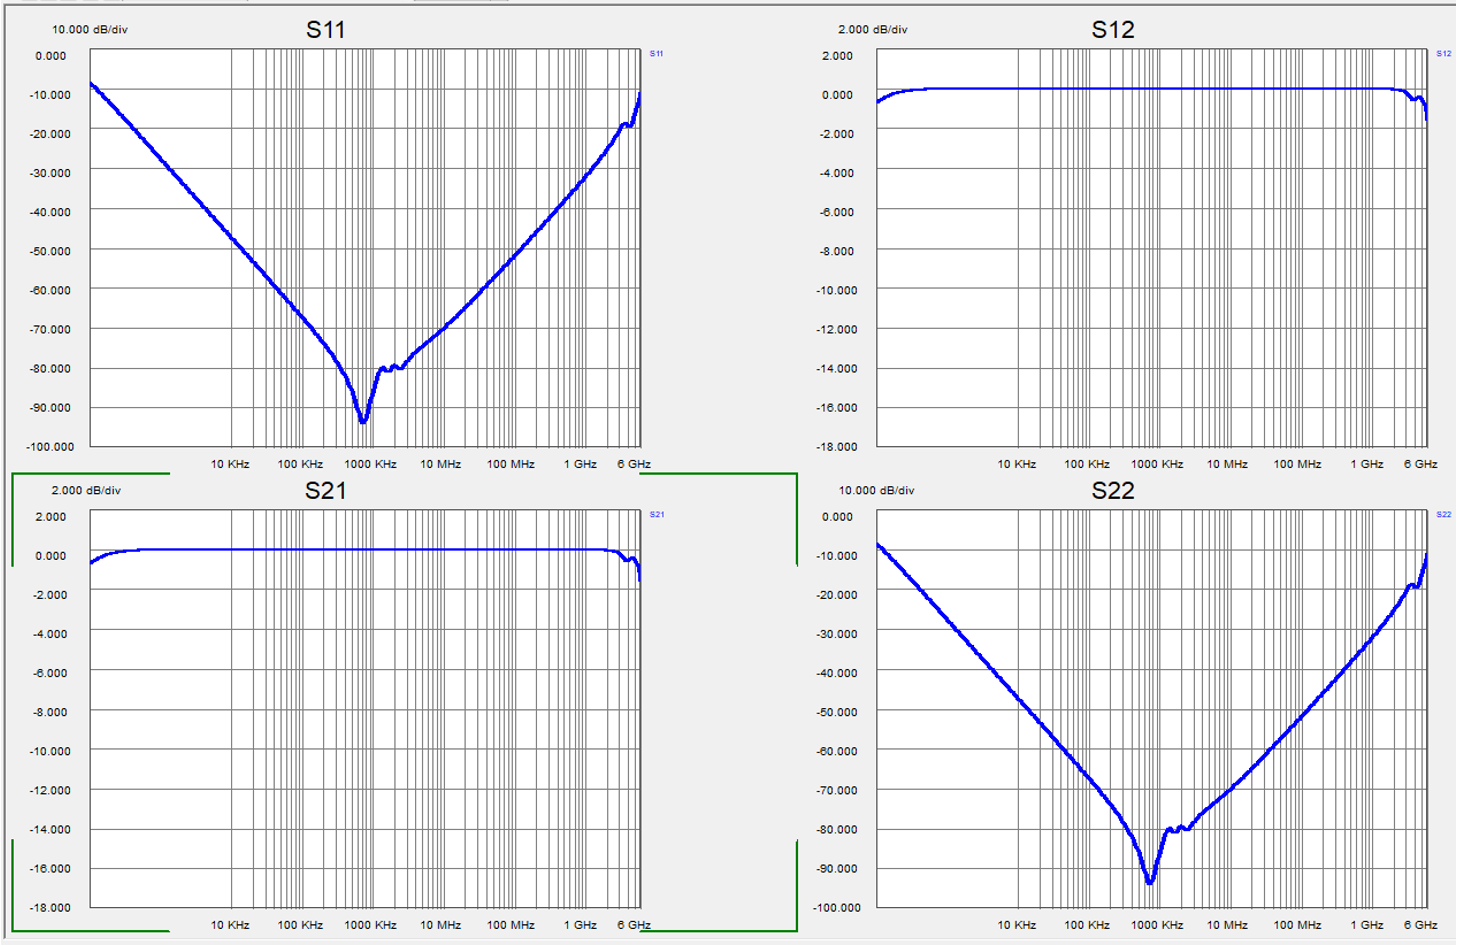
Figure 5. Accurate S-parameter model of the GRM32ER60J476 capacitor in Series mode also shows identical responses for S11 and S12.
We can analyze the data of the two model files and convince ourselves that what looks in perfect graphical agreement on the screen is in fact the case down to the numerical resolution of the data: S11=S22 and S21=S12. If we compare the plots in the two figures, we notice that the characteristic V shape associated with capacitor impedance profiles shows up in S11 and S22 in the Series mode model and in S21 and S12 in the Shunt mode model. The only difference is a vertical offset of four (or 12 dB), which comes from the difference how we calculate the unknown impedance from S11 vs. S21.
A circuit simulator doesn’t know what the model represents and therefore to work properly, the simulator needs all four S parameters in the matrix. You, on the other hand, know that the model represents a single capacitor. Moreover, you also know whether the model represents a series mode connected or parallel mode connected capacitor. Based on the definitions of the S-matrix elements, you can calculate the unknown impedance from any of the four matrix elements. Figure 6 illustrates the conditions for calculating S-matrix elements: S11 on the left for series mode connection and S21 on the right for parallel mode connection. Similar equivalent schematics can be drawn for the other S matrix element definitions as well.

Figure 6 Conditions for calculating the S parameters for series mode and parallel mode connections.
By using the symmetry and reciprocity, you have four different ways to calculate the Z impedance of the capacitor: a) from S11 (or S22) of the series connection model, b) from S21 (or S12) of the series connected model, c) from S11 (or S22) of the parallel connection model and d) from S21 (or S12) of the parallel connection model.
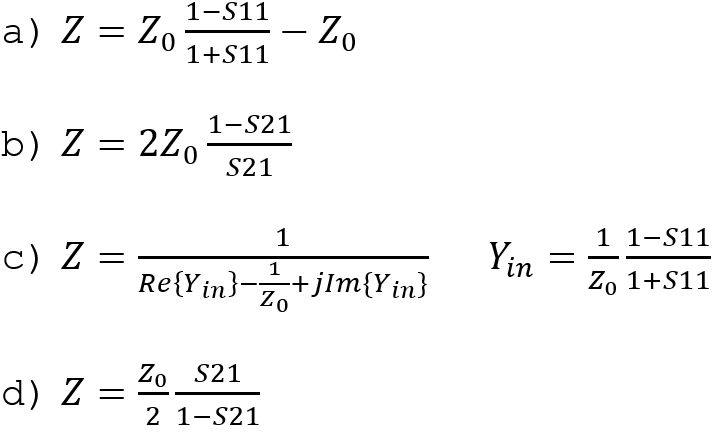
To illustrate that in fact all of the above ways produce the same result, Figure 7 plots the impedance magnitude calculated from the above four possible options. As expected, all four lines run exactly on top of each other.
The red line shows the measured impedance profile of the same capacitor. Note that the only minor difference comes from a slight shift of the series resonance frequency, which is due to differences in the test fixtures used for measuring the component. The accurate S parameter model accurately captures the frequency dependence of inductance and the secondary resonances.
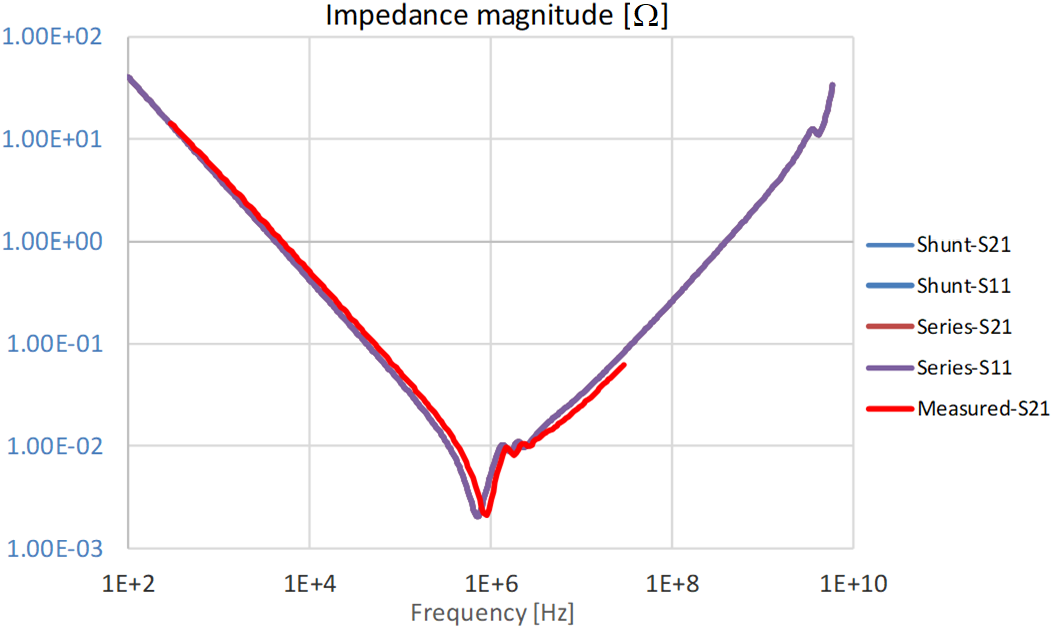
Figure 7 Capacitor impedance magnitude extracted from the series mode and shunt mode S-parameter models over the 100 Hz 6 GHz frequency range. Red trace: measured impedance from Two-port Shunt-through configuration.
Finally, remember that while you can use any of the above four possibilities to calculate the impedance of the capacitor from simulation models, when it comes to measurements of low-impedance capacitors, practical limitations and typical measurement errors limit us and you can use only S21 (or S12) from the parallel connection data.
Source: EDN article
by Istvan Novak, PhD is Principle Signal and Power Integrity Engineer at Samtec.
featured image source: Murata
- Space-Grade components available for immediate delivery - April 10, 2025
- Managing EEE components for LEO and lower cost space missions - December 17, 2024
- Filtering Characteristics of Parallel-Connected Fixed Capacitors in LCC-HVDC - November 21, 2024

0 comments on Bypass capacitor S-parameter models: What you need to know