Dielectric Capacitor Insulation Resistance (IR)
- Posted by Tomáš Zedníček
- On August 27, 2020
- 0
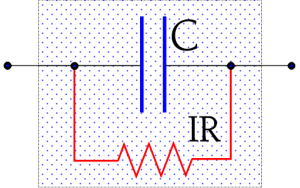
Figure: Schematic of the Insulation Resistance IR in a capacitor.
Insulation Resistance, IR
The dielectric of a capacitor has a large area and a short length (check the capacitors need it in your design in our database, doEEEt.com). Even if the material is a good isolator there always flows a certain current between the charged electrodes (the current increases exponentially with the temperature). This leakage can be described as a parallel resistance with a high value, an Insulation Resistance (Figure: Schematic of the Insulation Resistance IR in a capacitor.). We use the abbreviation IR in the following.
Measurement of the IR
At an IR determination, one measures the DC leakage current through the capacitor. The measuring circuit, however, always contains a certain series of resistance.
Hence we need to take into consideration the charging time. The circuit diagram and the charging curve for a capacitor are shown in the next Figure.
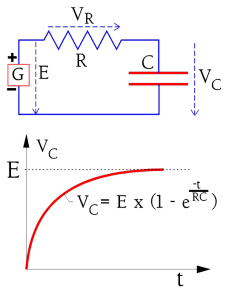
Figure: The charging curve for a capacitor in a resistive circuit.
The charging current to the capacitor is shown in Figure named Ideal and real charging current in a capacitor. (circuit diagram as in Figure above). If the capacitor were ideal the current would rapidly attain the limiting value corresponding to the IR. The ideal current curve is designated IC-ideal. But because the polarization in the dielectric requires a finite time for dipoles to reorient the real charging current follows the curve IC-polarization.
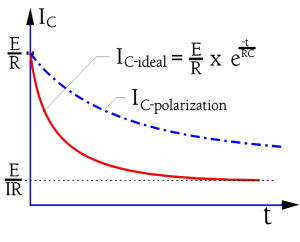
Figure: Ideal and real charging current in a capacitor.
In order to attain the actual IR we would need to wait for a very long time. In practice, we content ourselves with a specified IR value corresponding to a measuring current at the time tmeasure in the next Figure. Here we have marked a specified current valuewhich on the measuring devices are graded in the corresponding IR value. A common time for IR readings is in IEC specifications 1 minute. The MIL specifications often call for 2 minutes or more. Considerably shorter times are applied at incoming and production inspections. Information in this book is based on the 1-minute value if nothing else is stated. Additionally, the IR concerns the ”room temperature condition” (RT), approximately 23 °C. The IR decreases with an increase in part temperature and may, at the maximum temperature, be several 10 powers lower than at RT.
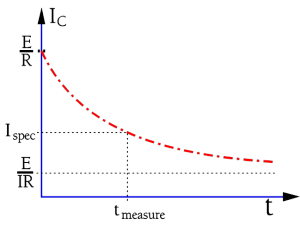
Figure: Time limitations at IR measurements.
The IR of capacitors of a specific type and voltage rating decreases proportionally to the growth in capacitance (i.e., the increasing area). And vice versa. A reduced capacitance by a correspondingly lessened area will increase the IR. However, up to a specific maximum value of capacitance, the IR actually is so high that it’s actually the outer construction and the molding or conformal coating that determines measured values. Up to this point, one specifies the IR in M. Above this breakpoint the specifications call for the constant product of IR x C (in seconds). This product also is designated the time constant (see next section).
For electrolytic capacitors with their relatively low IR rather the leakage current is specified.
The time constant
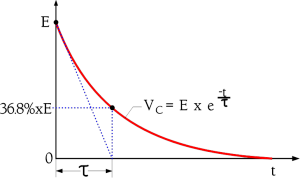
Illustration of the time constant .
If we leave a charged capacitor with open connections the charge successively will leak from one electrode to the other through the internal insulation resistance. Eventually the voltage will drop to zero. Because of the very high IR of the electrostatic capacitor (non electrolytic) a complete discharging will take an extremely long time. A more comprehensible measure of the discharge speed is the time constant. It is defined as the time for the initial voltage E to drop to the value 1/e by E (Figure C3-14). With reference to Figure C1-11 and -12 we can define as the product IR x C. This quantity is deduced from equation (C1-1) as Ω x As/V = Vs/V = s(econds). Periodically one sees the expression ohm-farad (ΩF) or the somewhat awkward megohm-microfarads (MΩF). Instead of using the expression IR x C it’s customary to mention only the RC product of the capacitor. Then R is understood as IR, i.e. IR x C = RC = τ .
τ = RC (s) or (ΩF) ………….[C1-8]
Dielectric Withstanding Voltage
The dielectric strength of the material is determined by the breakdown voltage and is expressed in kV/cm. As time, temperature and other factors determine the breakdown voltage this is reflected in conditions for measurements of the dielectric withstanding voltage, DWV. They are performed at a specified temperature, material thickness, frequency and shape of the test voltage curve as well as connection method. DWV usually is determined as an average value of a set of samples due to the effects of material variations etc.
Corona voltage
A practical and important limit for the breakdown voltage is the corona voltage, i.e. that voltage where corona starts appearing. Corona is initial electrical discharges in gases which then are ionized. The ionized products in the air or in carbon-rich environments, typical in all microcavities or voids in the dielectrics as well as in large cavities within the component package, consisting of ozone and nitrous fumes. Most organic dielectrics are directly affected by degradation. If the gaseous products have been created within a hermetically-sealed package as their concentration
increases they will degrade the behavior of organic dielectrics. Remember that AC peak voltages just above the corona voltage every half-cycle give a new contribution to the corona products. Additionally, there is a heat release from the corona phenomenon which further accelerates the chemical decomposition.
On the whole there is a certain smallest field strength
needed in the cavity in order to start ionization. Moreover the ionization gap length comes into play. But even if the field strength according to the formula C1-6 should be considerably higher in one part of a mixed dielectric AC voltages below 250 V R.M.S. are harmless also in the most unfavorable case. On one condition: No incoming transients should be allowed that otherwise might start an ionization course of events. Hence we ought to create safe margins based on our knowledge of occurring transients. If unsure, one should use capacitors where the voltage is distributed over elements connected in series.
Transients and anomalies in the dielectric are a dangerous combination.
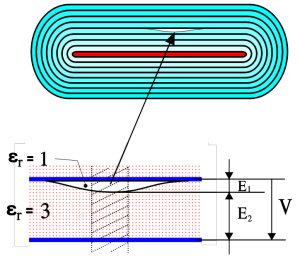
Figure: A partially mixed dielectric consisting of a layered composite of the organic dielectric and of the gases in the void.
The following example will demonstrate the danger. For the sake of simplicity, the measurements and dielectric constants are chosen as in Figure on the left. From formula C1-6 we obtain εr1 x E1 = εr2 x E2; 1 x E1 = 3 x E2; E1 = 3E2. Here we unintentionally have got an electric field strength 3 times the rated one. ”Safe” rated AC voltages just below 250 V or incoming transients certainly will start corona in such a void.
In high voltage ceramic capacitors intended for high-reliability systems a testing and screening technique is used to detect voids and delaminations by evoking partial discharges (corona). The method uses preferentially AC voltages just above the corona inception voltage (CIV) and is able to detect voids exceeding EIA-469 size requirements [1].
Test voltage
The test voltage is a practical guarantee value of the capacitor. It is positioned well below the corona voltage and is applied for a specific limited time, e.g. 2 seconds at production control and 1 minute at type tests and incoming inspection. Common test voltages may be 1.5 x VR, 2 x VR and the like.
[1] Partial Discharge Testing and Long Term Reliability, by Jeff Day et al, KD Components Inc., NV 89701. CARTS 98, March 1998.
- Why low ESR matters in capacitor design - May 24, 2021
- Voltage and Frequency Dependence on Resistors - March 6, 2021
- Permeability concept in Inductors - March 4, 2021

0 comments on Dielectric Capacitor Insulation Resistance (IR)